 Perception of Crime – Community DashboardMeasuring Esquimalt and Victoria residents’ Perceptions of Crime helps us determine how safe the citizens we serve feel.Feeling safe in one’s community is an important aspect of overall quality of life. This Perception of Crime chart reflects the perception of safety among citizens in Victoria and Esquimalt as expressed through past VicPD Community Surveys. Specifically, it shows the percentage of respondents who indicated that crime in Victoria or Esquimalt (depending on residency) has increased, decreased or stayed the same during the last 5 years. VicPD Community Surveys were conducted in 2014, 2017 and most recently in 2020.To interact with the below chart, you can filter by year on the right side by clicking once on the desired year. You can also click directly onto the chart and confirm the selection by clicking the green checkbox.
 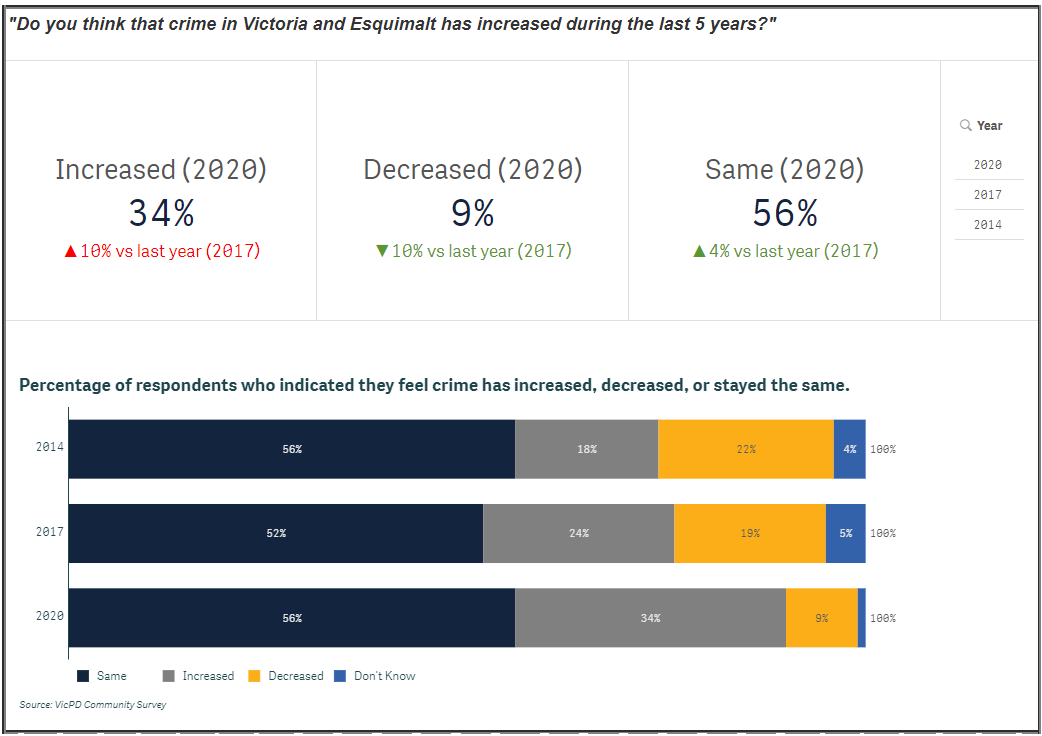 We Want to Hear From You!As part of our goals to improve your understanding of how we work and what measures we’re using and why, we welcome your feedback. Please email us your questions and suggestions.Up NextNext week, we take a closer look at a measure generated by an ongoing VicPD Crime Prevention Program; VicPD Block Watch.Each week we’re looking at one of our Open VicPD Community Dashboard measures in detail to help you understand what we’re measuring, why we’re measuring it and how we think it helps you track our progress towards achieving our goals. Join us on Twitter, Facebook, Instagram and VicPD.ca to come along for a deeper dive into Open VicPD. -30-